Create Beautiful Infographic Designs
|
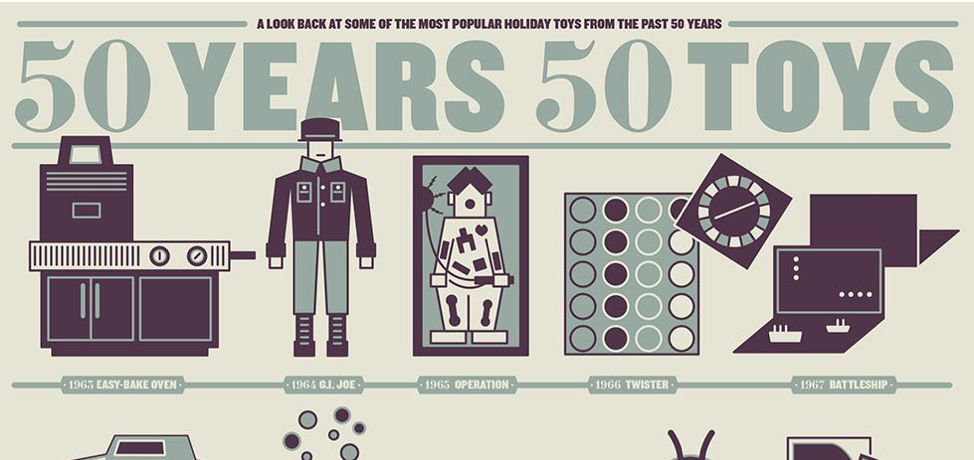
50 Years, 50 Toys
EVERYONE HAS EXPERIENCE WITH TOYS - Although this infographic is targeted to a certain audience, it is almost guaranteed to draw you in. Simplicity and using well-known products in the graphic forges an emotional connection between reader and graphic. The colors are muted, letting the images tell the story.
EVERYONE HAS EXPERIENCE WITH TOYS - Although this infographic is targeted to a certain audience, it is almost guaranteed to draw you in. Simplicity and using well-known products in the graphic forges an emotional connection between reader and graphic. The colors are muted, letting the images tell the story.
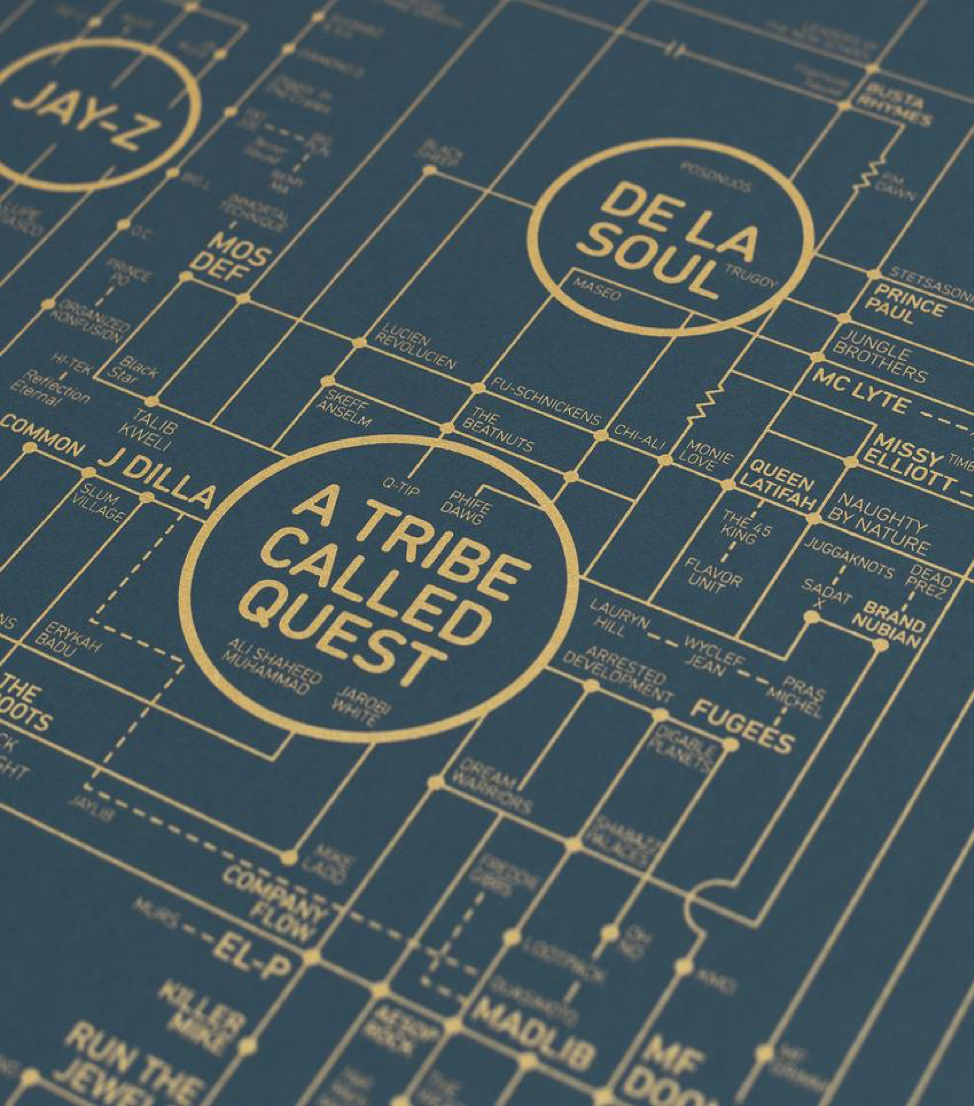
Hip Hop Blueprint
Almost works of art in themselves, this infographic displays the branching of music within the genre of Hip Hop. It allows the reader to easily follow the influences and branching off of certain genres within an overarching musical style. Large bubbles allow the reader some reprieve from the visual journey.
Almost works of art in themselves, this infographic displays the branching of music within the genre of Hip Hop. It allows the reader to easily follow the influences and branching off of certain genres within an overarching musical style. Large bubbles allow the reader some reprieve from the visual journey.
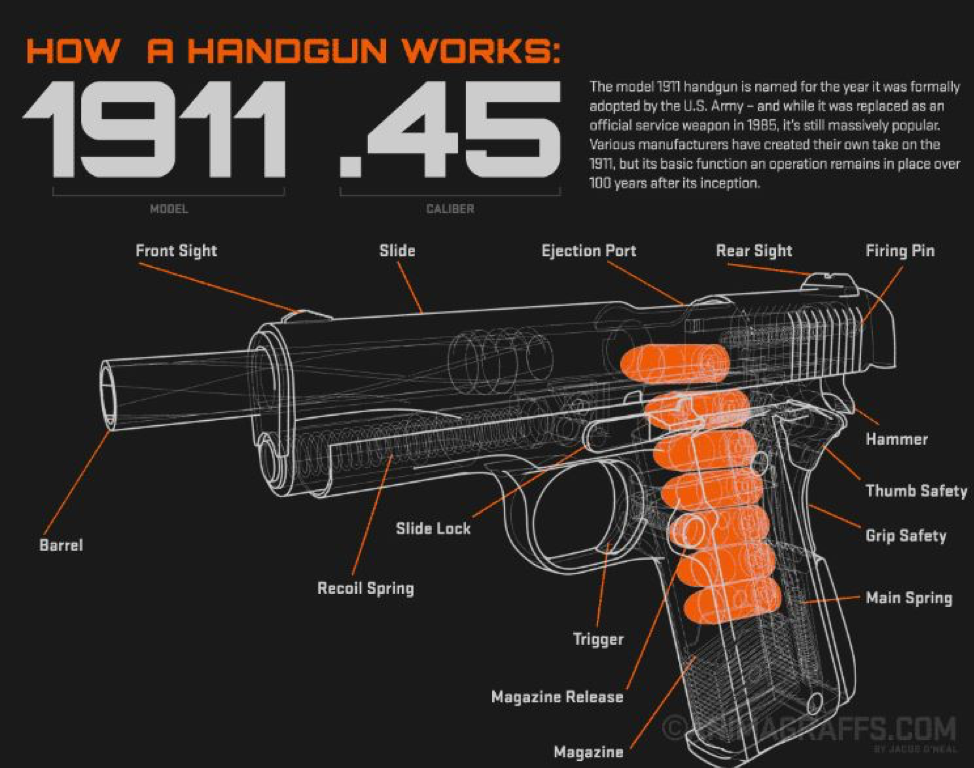
How a Handgun Works
GREAT VISUAL - this piece explains how a handgun works when firing a round. Again, the blueprint style of the design gives an attractive edge to the graphic. The use of colors to highlight the section being described allows the reader to easily follow along and understand the concepts.
GREAT VISUAL - this piece explains how a handgun works when firing a round. Again, the blueprint style of the design gives an attractive edge to the graphic. The use of colors to highlight the section being described allows the reader to easily follow along and understand the concepts.
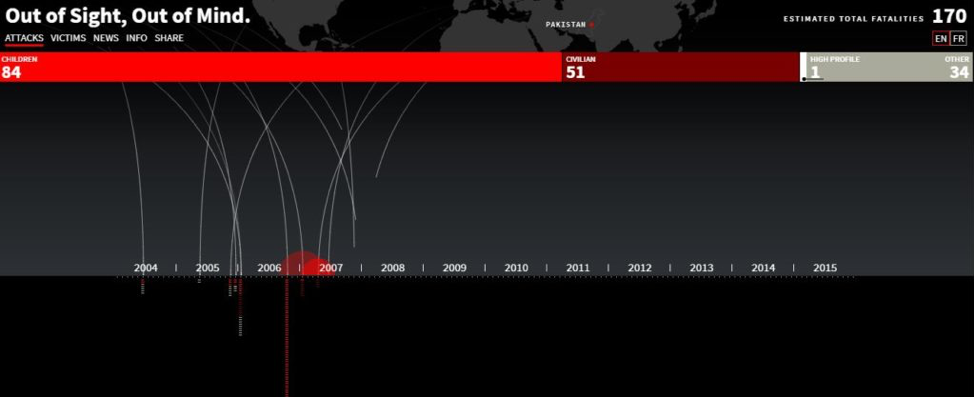
How Many People Do Drones Kill?
THIS IS WAY TOO SOPHISTICATED TO USE AS A MODEL BUT IT IS REALLY COOL…Relying on emotion and shock factor, this graphic takes the reader through the story of how many people are killed by drones in a given year. Breaking down the deaths from targeted individuals to civilians and children, this graphic was designed to invoke a response from its audience and does so well.
THIS IS WAY TOO SOPHISTICATED TO USE AS A MODEL BUT IT IS REALLY COOL…Relying on emotion and shock factor, this graphic takes the reader through the story of how many people are killed by drones in a given year. Breaking down the deaths from targeted individuals to civilians and children, this graphic was designed to invoke a response from its audience and does so well.
THE GREAT EIGHT INFOGRAPHICS – CHECK THEM OUT AND BE INSPIRED AND ENTERTAINED:
- Lightning
- How Common is Your Birthday (NYT data)
- 50 Insane Facts about Australia
- Deaths on Mount Everest
- All About Mt. Everest: The Top of The World - by Utsav Subramani ...
- What To Do When the Internet is Down
- Are You Happy?
- How to Survive the Zombie Apocalypse
